Site logo
AboutVideos & Tutorials
  • About
  • Videos & Tutorials

Videos and Tutorials

 Getting started with @the-vcsi/scrolly-kit (33:13)

Getting started with @the-vcsi/scrolly-kit (33:13)

ⓘ
Here’s a tutorial for anyone who might want to get started with data-driven stories using the scrolly-kit.
 From Excel to Interactive Website: Data-Driven Stories Made Simple (2:09)

From Excel to Interactive Website: Data-Driven Stories Made Simple (2:09)

ⓘ
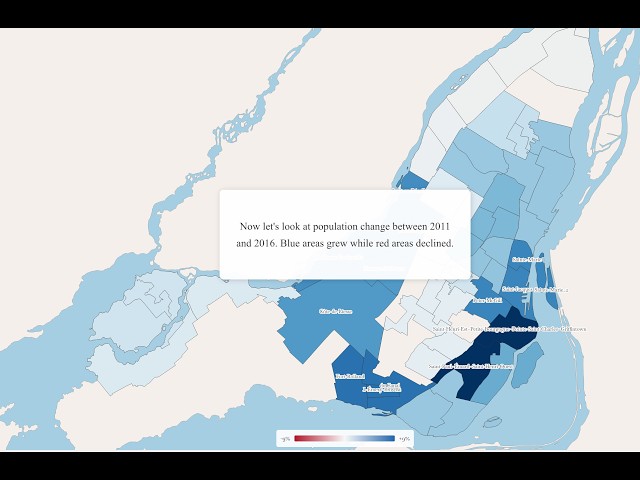
Most researchers want interactive stories to share their work, but building them requires expertise most labs don't have. At VERSO (https://verso.w3.uvm.edu/), we developed a open-source static website template to learn and share data-driven stories. It even integrates with SharePoint — so anyone on your team can update content without writing code. See how it works at https://vcsi.cmplxsys.w3.uvm.edu/.
Introducing VERSO templates to start building interactive stories (2:56)

Introducing VERSO templates to start building interactive stories (2:56)

ⓘ
You can see the templates live at https://vcsi.cmplxsys.w3.uvm.edu/scrolly-story-1/. The code lives in the following Github repository: https://github.com/Vermont-Complex-Systems/website-template. Vermont Research Open Source Program Office (VERSO) at UVM main website: https://verso.w3.uvm.edu/. Our main website showcasing the science we do at the Vermont Complex Systems Institute: https://complexstories.uvm.edu/. P.S. The amazing story we showcase at first is by Nadieh Bremer: https://endfund.org/visualizing-neglect/.
Building Data Pipelines for Scrollytelling with Dagster (21:18)

Building Data Pipelines for Scrollytelling with Dagster (21:18)

ⓘ
Introduction to ETL data pipelines using Dagster, providing the input to a scrolly story.- The project is live that: https://vcsi.cmplxsys.w3.uvm.edu/geo-story-1/- The code can be found: github.com/jstonge/dag-montreal/
Building Principled Data Pipelines for Scrollytelling with Maestro (22:10)

Building Principled Data Pipelines for Scrollytelling with Maestro (22:10)

ⓘ
Introduction to principled data processing using Maestro, providing the input to a scrolly story.- The project is live that: https://vcsi.cmplxsys.w3.uvm.edu/geo-story-1/ - The code can be found: https://github.com/jstonge/rdag-montreal/ You can find Nadieh bremer amazing work at https://www.visualcinnamon.com/.
Scrollytelling with background map using svelte (26:11)

Scrollytelling with background map using svelte (26:11)

ⓘ
Following https://youtu.be/coJUJmfrnaQ, we walk through the svelte code to make an interactive scrolly telling story with a background map.
Logo
Accessibility Privacy/Terms of Use
© 2026, Vermont Complex Systems Institute